Analytics Dashboard Morph
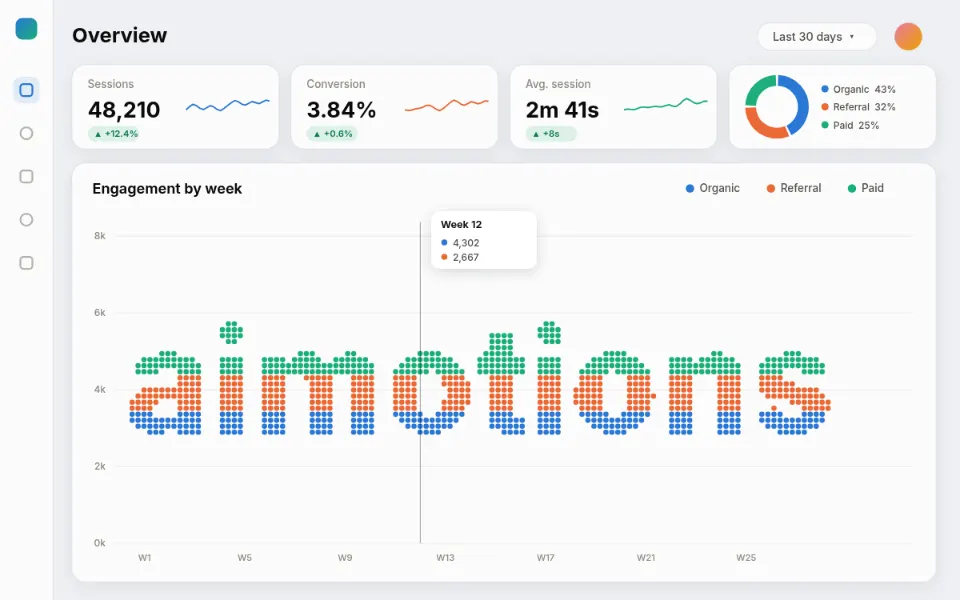
A light analytics dashboard grows a stacked column chart whose bars break into dots that fly up and rearrange into the word. Made for SaaS, fintech, annual reports and data-driven brand stories.
Prompt · replace [TEXT]
Tool-agnosticBuild a light analytics dashboard that turns its data into the word [TEXT]. Light gray page, white rounded cards with soft shadows, a slim icon sidebar, a header with a date-range pill, four KPI tiles with live-ticking numbers, sparklines, green delta chips and a small donut. The main card shows a stacked column chart in blue, orange and aqua with hairline gridlines; the columns grow up from the baseline, break into a grid of round dots, and the dots fly in a staggered wave to form [TEXT] in a heavy sans, keeping their color bands (blue at the bottom, orange in the middle, aqua on top). A vertical crosshair with a small tooltip snaps across the word. Hold, fly the dots back into columns and loop.
Visual DNA
- Light gray page, white rounded cards with soft shadows and hairline grids
- Stacked columns in blue, orange and aqua with 2px gaps and rounded tops
- Bars dissolve into dots that fly to the letters, keeping their series bands
- Live KPI tiles with sparklines, delta chips and a donut chart
- Crosshair tooltip that snaps across the word like a hover readout
- Category
- Sci-fi UI & Modern Web
- Demo built with
- Canvas
- Energy
- Lively
- Background
- Light bg
Also known as
Support
Keep aimotions free
Buy me a coffee No paywall, no sign-up. If a prompt saved you an hour, a coffee keeps new styles coming.
Keys: ← → browse · C copy